IEEE VIS 2020 workshop on
Information Visualization of Geospatial Networks, Flows and Movement (MoVis)
26 October 2020, Virtual workshop
Workshop Schedule
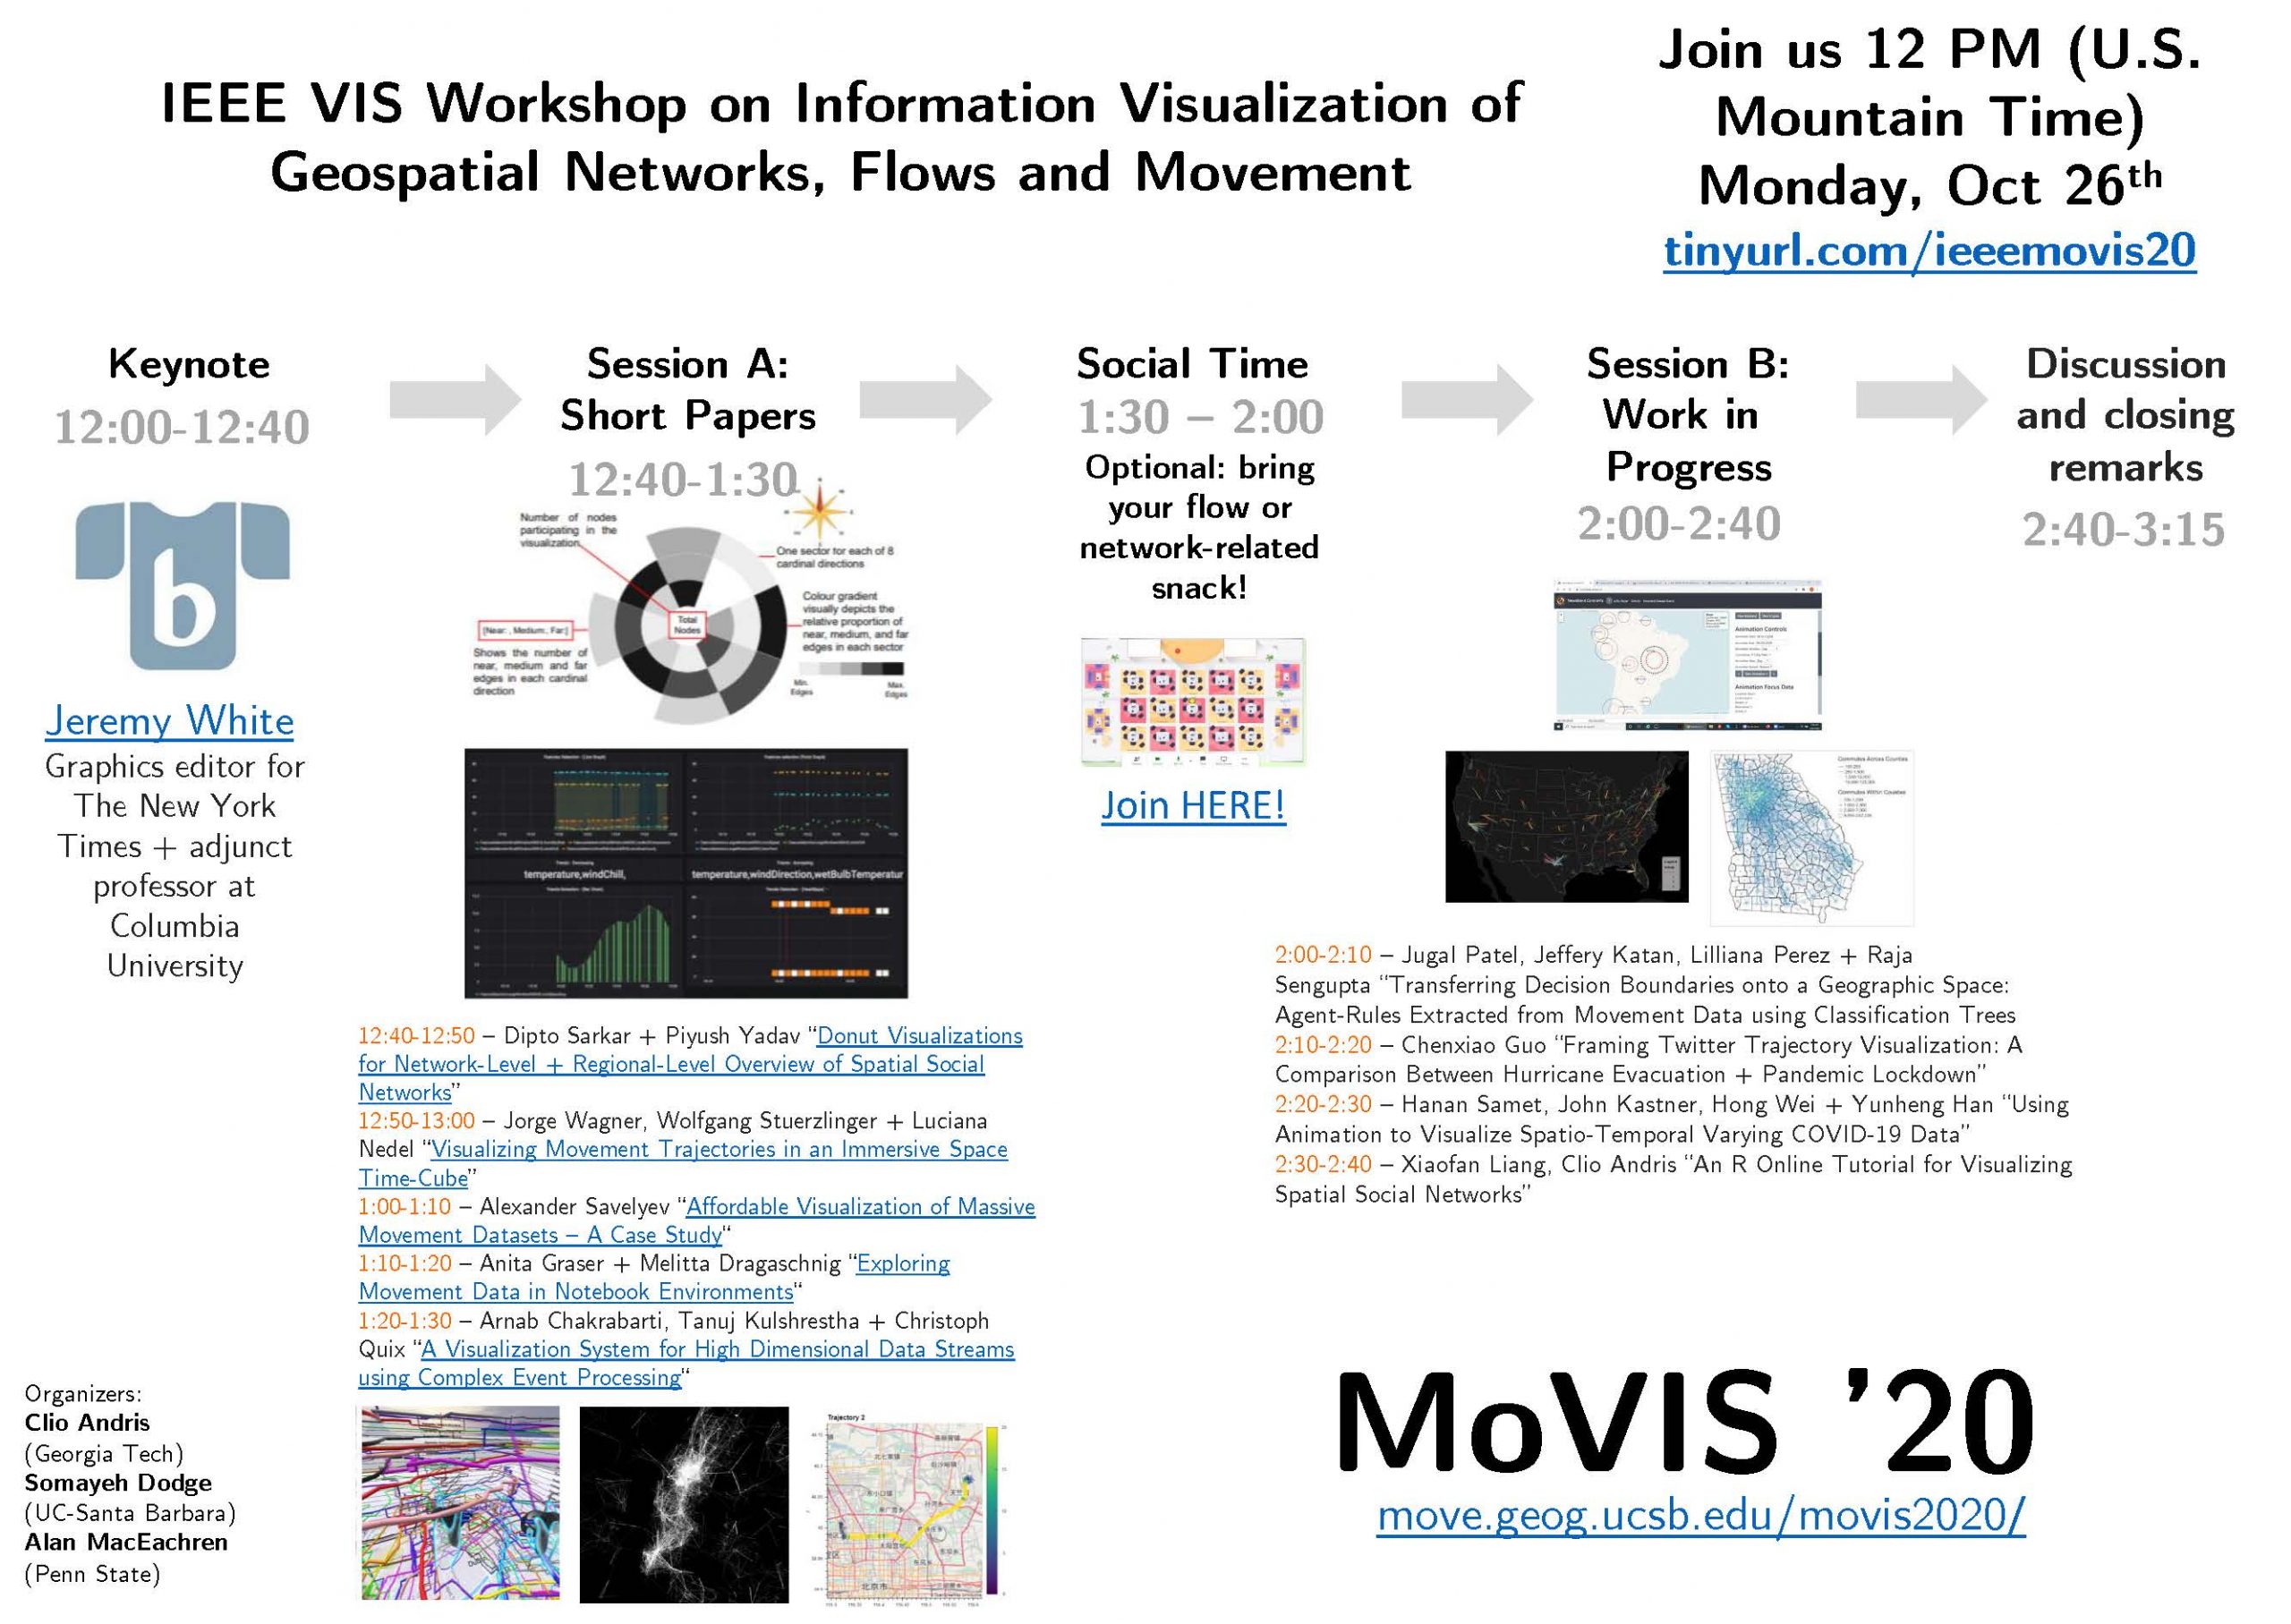
We are one of many exciting workshops at IEEE VIS which will be held on Monday, October 26th, 2020. Our workshop starts at 12:00 pm (US Mountain Time) and ends at 3:15 pm (US Mountain Time). Please download the visual guide to our schedule below.
Here is the link to watch the recorded live stream on YouTube: http://tinyurl.com/ieeemovis20
|
| Invited Keynote |
- 12:00-12:40 – Jeremy White (Graphics editor for The New York Times and adjunct professor at Columbia University)
|
| Short Paper Session Talks |
|
Break and Social Time 1:30 pm – 2:00 pm (US Mountain Time)
Join us for breakout rooms using this link. |
| Session B 1:45 pm – 3:15 pm (US Mountain Time) Streaming live on YouTube |
| Interactive Session for Work in Progress |
- 2:00-2:10 – Jugal Patel, Jeffery Katan, Lilliana Perez and Raja Sengupta “Transferring Decision Boundaries onto a Geographic Space: Agent-Rules Extracted from Movement Data using Classification Trees
- 2:10-2:20 – Chenxiao Guo “Framing Twitter Trajectory Visualization: A Comparison Between Hurricane Evacuation and Pandemic Lockdown”
- 2:20-2:30 – Hanan Samet, Yunheng Han, John H. Kastner, and Hong Wei “Using Animation to Visualize Spatio-Temporal Varying COVID-19 Data”
- 2:30-2:40 – Xiaofan Liang “An R Online Tutorial for Visualizing Spatial Social Networks”
|
|
- 2:40-3:15 – Discussion and closing remarks by the organizers
|
Workshop Summary
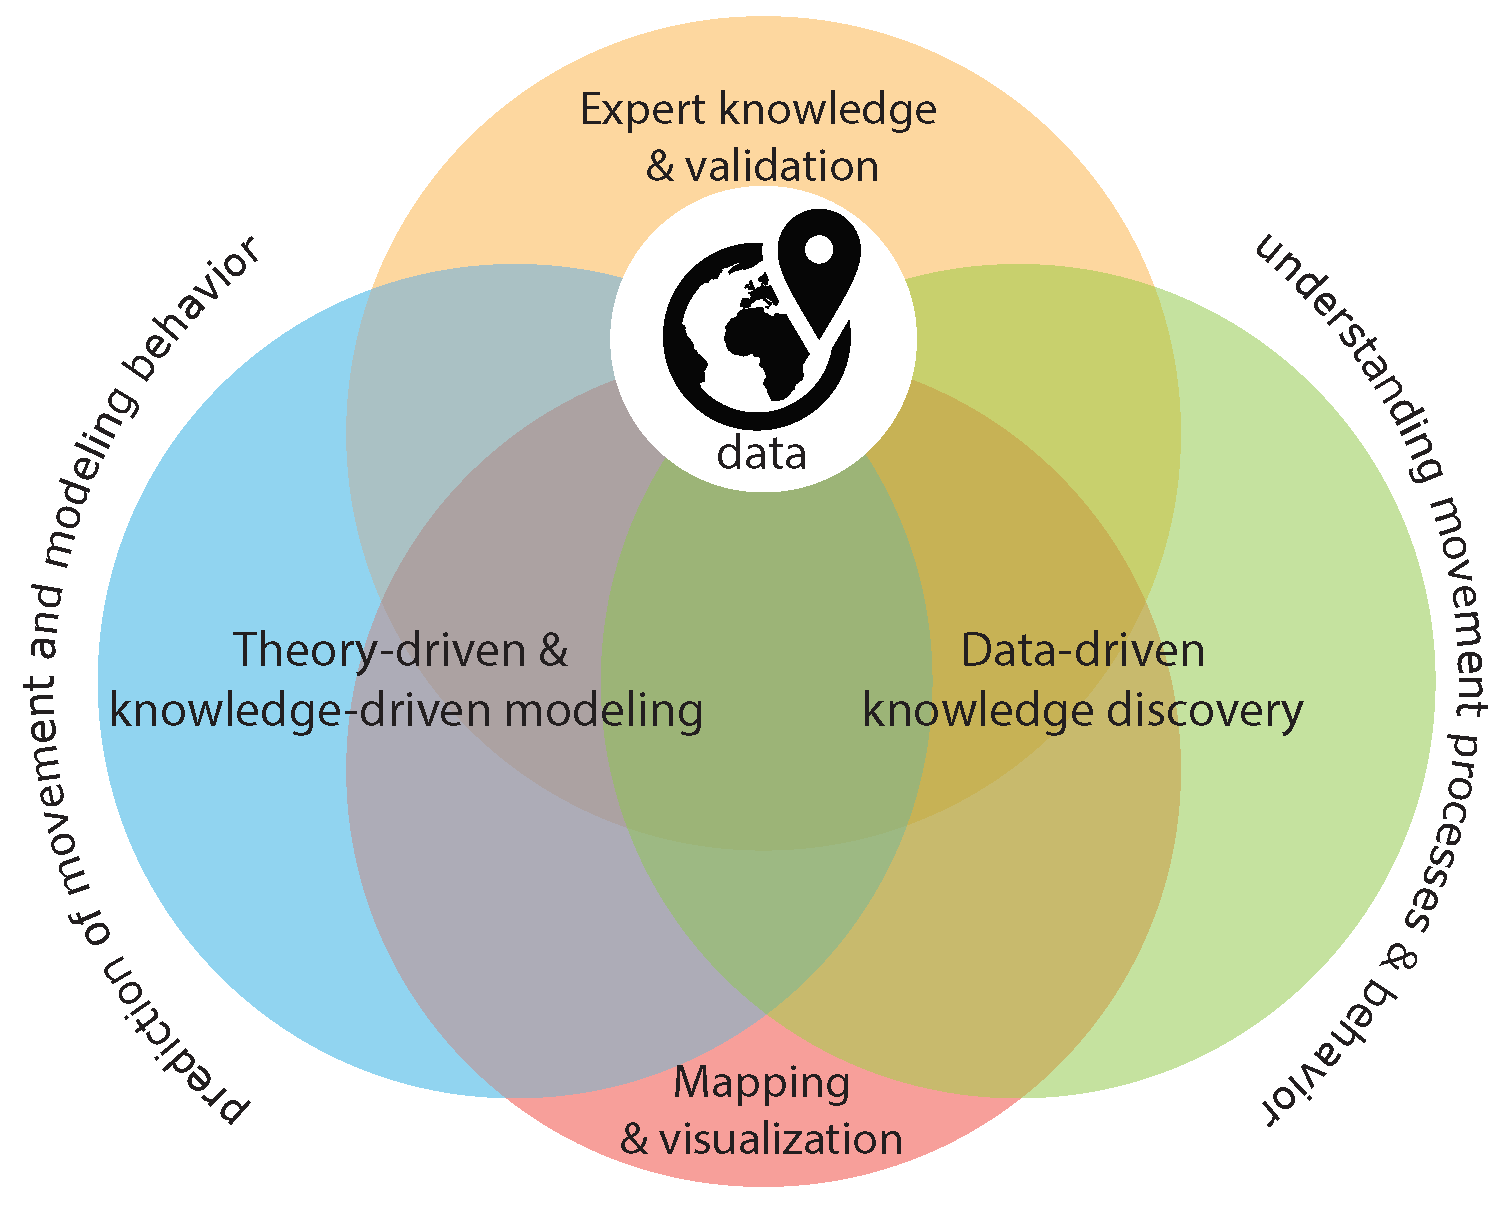
Researchers frequently access and visualize data that represent spatial connections. These include GPS trajectories, migration movement, mobile phone-based movement, social networks, flights, commutes, SMS/phone call connections, human and animal movement trajectories, commuter flows, international trade, disease transmission flows, remittance flows, online friendship connections and transportation magnitudes. They are important in the study of globalization, wealth distribution, information spreading, epidemiological modeling, economics and infrastructure management. At the same time, analyzing these data requires advanced visualization methods. The objectives of this workshop are to explore the best ways to visualize large, spatio-temporal flow systems with both node and edge attribute data; describe the best visualization methods to unearth meaningful results; facilitate the use of diverse big data sets, communicate these results through visualization and description; and reflect upon how visualization is best communicated for urban and regional studies, geography, urban planning, public health, civil engineering, sociology and related fields.
The MoVIS ’20 workshop is situated in a larger body of research on geovisualization, geospatial data analytics and exploratory spatial data analysis (ESDA). This body of work includes mapping spatial datasets using different visual techniques, and assessing how humans interact and gain insights from spatial data. Spatial flow data is a special type of data that presents issues like the “haystack” problem of overlapping flows, edge effects, issues of using polygon centroids as origins or destinations, and issues of scale and modifiable areal units.
Goals. The purpose of this workshop is to help advance the scientific capabilities of visualizing and interacting with large spatial connectivity datasets of movement, telecommunications and social relationship data. This workshop aims to provide a strategic link between the geographic information science (GIScience) and information visualization communities. The workshop will also expose researchers to a variety of flow data sources and enrich our knowledge of geospatial connectivity through innovative dynamic and static visualization tools and methods.
Workshop Themes
We invite submissions of short research papers (1500 words) or short abstracts of ‘work in progress’ (500 words) that describe new research ideas that fit the general theme of Information Visualization of Geospatial Networks, Flows and Movement, including, but not limited to, the following topics:
- Integrating thematic flows data with and reference maps
- Evaluating interaction methods with flows
- Comparing static vs. dynamic geographic flow visualization
- 3D visualization of flows
- Protecting privacy in visualizing GPS trace and movement data
- Expressing temporal dynamics
- Use of novel symbology combinations of transparency, color, thickness and interweaving techniques
- Integrating multi-modal flows into one visualization
- Dashboards and linked visualizations for data exploration with other data.
- Spatial social network visualization
- Interactive flow and network tools
- Flow bundling algorithms
- HCI considerations for user types and applications/case studies
- Capturing bias and behavior patterns with flow data
- Applying (a-spatial), force-directed, network visualization and graph drawing techniques to spatial problems
We will put special emphasis on supporting and nurturing the growth of emerging, nascent topics, including:
- Cross-scale (multi-scale) flows
- Multiplex networks (with multiple edge weights)
- Flow uncertainty
- Visual comparison of actual vs expected flows
- Visualizing flow predictions
- Open geospatial tools for flow analytics
- Machine learning for visualizing flow growth and expansion
Program Committee
- Anita Graser, Austrian Institute of Technology
- Caglar Koylu, University of Iowa
- Mauro Martino, IBM Software Group
- Sara Irina Fabrikant, University of Zurich
- Ming-Hsiang Tsou, San Diego State University
- Anthony Robinson, The Pennsylvania State University
- Alex Endert, Georgia Institute of Technology
- Charles Perin, University of Victoria
- Gennady Andrienko, Fraunhofer
- Natalia Andrienko, Fraunhofer
- John Stasko, Georgia Institute of Technology
- Alasdair Rae, University of Sheffield
- Polo Chau, Georgia Institute of Technology
- Jo Wood, City University London
- Menno-Jan Kraak, University of Twente
- Aidan Slingsby, City University London
- James Cheshire, University College London
Organizers contact details
- Clio Andris, Assistant Professor, School of City & Regional Planning and School of Interactive Computing, Georgia Institute of Technology, clio@gatech.edu
- Somayeh Dodge, Assistant Professor, Dept. of Geography, University of California – Santa Barbara, sdodge@ucsb.edu
- Alan MacEachren, Professor, Dept. of Geography, Pennsylvania State University, maceachren@psu.edu